Information Radiators are always a good idea for software teams, and I’ve been pondering how best to show project state at Eden Development for a while.
Here are the various iterations we’ve been through:
Iteration 1: Build status messages
We’ve had a continuous integration server running on integrity for several months, and we wanted to make it obvious how we were doing, so we got an old mac mini out and plugged in a big monitor. That way everyone could see whether our builds were passing or failing. We set the mac to come on at 9am and turn off at 6pm in System Preferences, and used Plainview to display full screen.
This worked well, except that our builds don’t fail that often: our current projects have short enough builds that developers can still get away with running all the tests locally.
Iteration 2: Enter the cycling metric_fu graphs
We have metric_fu running on a private site anyway, but the stats weren’t very visible. Wouldn’t it be cool if we could see our code stats publicly across the whole company? So we split the screen into two halves using a frameset:
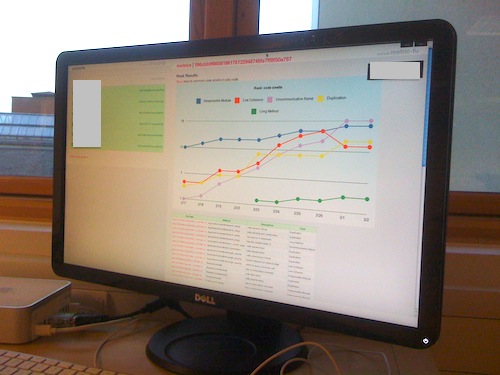
Each of our projects now cycles through the most important pages from the metric_fu library, for each of our live projects. That way, if there’s a big change in the graphs one day, everyone can see that there’s a problem and can dive in and fix it.
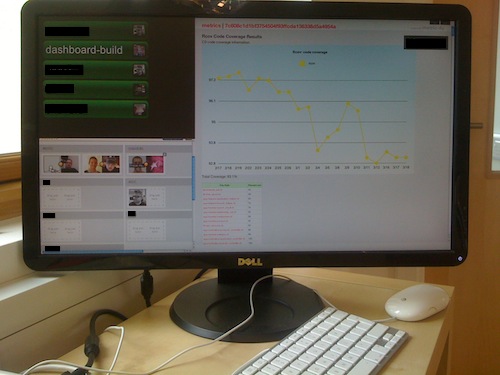
Iteration 3: Cramming more stuff in
So far so good, but we had some blank space down the bottom left! So we shoehorned in part of Pairyapp’s interface, so that everyone could see who was working with who.
This was nice, because people can suddenly see who’s working on a task on their own, and then jump in as needed. It stopped me trawling round the office just to find somebody: now I can easily see exactly who’s doing what (picture at the bottom).
Iteration 4: First pass on our own build server dashboard
This worked well, for about ten days…
…until we saw this. Our little solution was immediately not good enough and I set to work on make it shinier.
At about the same time we changed to using CI Joe for building our projects. The way we got that working is detailed here.
CI Joe doesn’t come with an integrated dashboard, so I set to work writing my own. Here’s where I’ve got to so far:
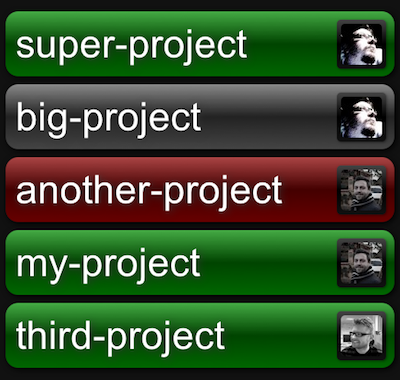
It’s not open source yet, but I plan to make it so soon. The pictures are of the person or pair who made the last commit.
Iteration 5: The final result
And here’s how our screen looks this morning:
(sorry about the censorship)
It’s not finished yet, I’ve plenty more plans. Expect another few posts on this in the future.
UPDATE: Added link to CI Joe post and explained pictures on the dashboard app.
Check out my indie game Sol Trader, an epic space action adventure. Be part of a living society you can befriend, understand and manipulate to your own ends.
Follow